Grid Hosting Capacity
The Belgian transmission system is continuously in evolution, both concerning connected grid users and concerning the grid infrastructure itself. This page intends to create insight into the grid hosting capacity that is today already reserved (or allocated) for additional grid usage of different types, as well as the remaining hosting capacity on top of those already reserved/allocated capacities.
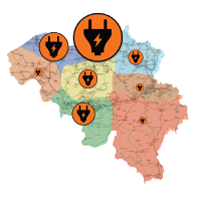
Hosting capacity reservations and allocations
The process for connecting new grid users or reinforcing existing grid connections is governed by theCode of Conduct Electricity. The maps below give a summarized view on these hosting capacity reservations and allocations for different regions in Belgium, and for different types of usage. They cover all reserved/allocated capacities on the transmission and distribution grid, as well as a margin for low voltage connected future evolutions (which do not require a capacity reservation/allocation and are therefore assumed, by default, to be reserved when computing the remaining available hosting capacity).
It is important to note that the transmission grid allows to connect the combination of all these projects, and therefore all volumes can be considered in a cumulative way. All underlying projects, for which capacity has been reserved or allocated (but without commissioning yet) are however not realized yet, and might exhibit different stages of maturity, going from projects in a very preliminary stage to projects near completion. This therefore also means that possibly, parts of this reserved/allocated grid capacity might be liberated in the future, when specific projects are abandoned by their respective developer.
Situation end August 2025.
Demand facilities |
Onshore wind |
Storage |
 |
 |
 |
| +72,7 TWh increase towards 2034 Total of 153,4 TWh |
+3,3 GW Increase towards 2034 Total of 6,9 GW |
+9,6 GW Increase towards 2034 Total of 9,8 GW |
To put this additional capacity into perspective, the table below summarizes the overall volume of additional reserved/allocated capacity on a national level. A pre-reserved margin was also included for growth potential for low-voltage connected heat pumps (HP) & electric vehicles (EV), as well as other high-, medium- & low-voltage production and demand facilities. For reference, the total is then compared to the global reference context that was formed the base for this grid study.
| NATIONAL TOTAL | ||||
| Currently existing volume (normalised) |
Additional volume taken into account (up to 2034) |
Total volume taken into account (up to 2034) |
Reference context for target year 2034 (see FAQ) |
|
| Demand Facilities | 80,7 TWh** | 56,8 TWh + 13,8 TWh (pre-reserved for HP & EV) + 2,1 TWh (pre-reserved for MV & HV demand) |
153,4 TWh | 126,4 TWh** |
| Onshore Wind | 3,6 GW | 2,5 GW + 0,8 GW (pre-reserved) |
6,9 GW | 6,9 GW |
| Offshore Wind | 2,3 GW | 3,5 GW | 5,8 GW | 5,8 GW |
| Solar | 11,4 GW | 1,1 GW + 5,5 GW (pre-reserved) |
18,0 GW | 18,0 GW |
| Large-Scale Batteries | 0,2 GW | 9,6 GW*** | 9,8 GW*** | 3,3 GW |
(*) For other types of production units (e.g. gas-fired power plants), the reserved/allocated capacity was also considered. The exact values are not shown for confidentiality reasons.
(**) Not including TSO losses.
(***) Includes reservations, pending reservations and allocations
Remaining available hosting capacity
The map below gives a simplified indication of the grid hosting capacities that are still available on top of abovementioned capacity reservations/allocations/low voltage connected evolutions and is considering already planned grid infrastructure development. Key to note here is that these capacities – contrary to the capacity reservations – are not cumulative, and therefore reflect the situation of the transmission system known at the time of the computation of the map. Once new capacity reservations are granted in a certain region of the transmission system, this might therefore impact the remaining hosting capacities for other connection points in the same region, and even for connection points in other impacted regions. To reflect those changes in reserved capacities, the map is updated monthly. The most recent time of computation is indicated on this web page, on the top-left of the map.
The reported hosting capacities take into account planned grid infrastructure development, as published through Elia’s Federal Development Plan and Regional Investment Plans, and are in line with the state of Elia’s infrastructure project portfolio known at the time of computation.
The reported capacities relate to the transmission and local transmission grids only, and for projects below 300 MW. Practically this means that the reported capacities give no information about connections at the distribution grid-level – for which a connection study at the relevant DSO is also required – nor at the EHV level (> 300 MW), for which more detailed location-specific analyses are required. The connection possibilities on low voltage grids (i.e. < 1 kV) are not impacted by the hosting capacities provided in this map.
This map is intended to pre-inform grid users on a first, high-level view on grid hosting capacities on top of already reserved/allocated capacities. However, when a grid user has a specific project, the existing processes regarding orientation and detailed connection studies are to be followed. Through such studies, Elia will verify several additional constraints which are not taken into account for this publication, such as spatial constraints in the substation, short-circuit current constraints, voltage constraints, etc.
More information can be found in theFAQ. Would you like to become an Elia customer? If you are already an Elia customer, are you looking for a Key Account Manager, or do you have questions about invoicing, technical work or nominations? Find out who tocontact here. For any further questions about the hosting capacity map, you can contact Elia via hostingcapacitymap@elia.be.
Disclaimers
- Scope: this map visualizes an approximation of the hosting capacity on the Elia grid for nominal capacities < 300 MW.
- Higher capacities cannot be estimated without location-specific detailed analysis through a specific orientation study.
- The connection possibilities on low voltage grids (i.e. < 1 kV) are not impacted by the hosting capacities provided in this map.
- Validity: all information shown is non-binding. It is based on the best estimation of scenarios and realization of the infrastructure project portfolio known at the time of computation. Furthermore, no full guarantee on data quality can be given in this framework.
- Uncertainty: the further in the future is the time horizon for the computed hosting capacity, the higher is the uncertainty in the hosting capacity determination due to uncertainties in the forecasting of the reference context as well as the possibility to adapt the development plans.
- Added value of connection studies: identifying the actual hosting capacity always requires expert analysis, calculations based on the latest information and considering voltage and short-circuit power limits, stability phenomena, permits, technical feasibility, grid and topological optimizations as well as an adaptation of the development plans in common interest of society. Therefore, the final specific grid user connection proposal and thus the connection capacity could either go beyond or be more limited than the values shown on these maps.
- Involvement of Elia: please do not hesitate to contact Elia to discuss your grid connection needs. The sooner Elia is involved in your project, the sooner a suitable solution can be developed.